More than "UX sugar"


Node.js V8 --inspector Manager (NiM) "adds some nice UX sugar on top"... of Node.js debugging. That's for sure. However now that the DevTools team has built in a solution for the UUID problem, some have disparaged NiM, out of what I would call ignorance of the capabilities of the tool. Many however still understand the value that NiM offers as it's growth shows. While the tool may have started as such, NiM is definitely more than just UX sugar, and the purpose of this blog post is to shine light on the other unique aspects of NiM namely:
- VSCode Integration
- Custom DevTools
- Vendor (3rd party node debug tools) Agnosticism
1. VSCode Integration
There is an extension in the VSCode Marketplace (as well as on GitHub) that makes debugging with tools outside of VSCode while simultaneously using VSCode possible. It does this by making the metadata generated by the built in node --inspect process available via a local http endpoint, much the same that node --inspect publishes debug metadata to http://localhost:9229/json, the NiMS extension re-publishes all VSCode owned node process metadata to http://localhost:6607.
One of the problems that I see when using tools that spawn node as a child process of their own such as VSCode, is in the fact that they effectively hide this metadata that the node process makes available via it's stdout stream (specifically the JSON endpoint), thus making debugging from outside tools more difficult. In fact that's part of the reason I haven't gone further down the ndb route, because it too runs as the parent process spawning the node executable as a child. It seems to me that node acting as the parent process is probably the closest match to what will be found in a production environment, but I would love to know others opinions on the matter.
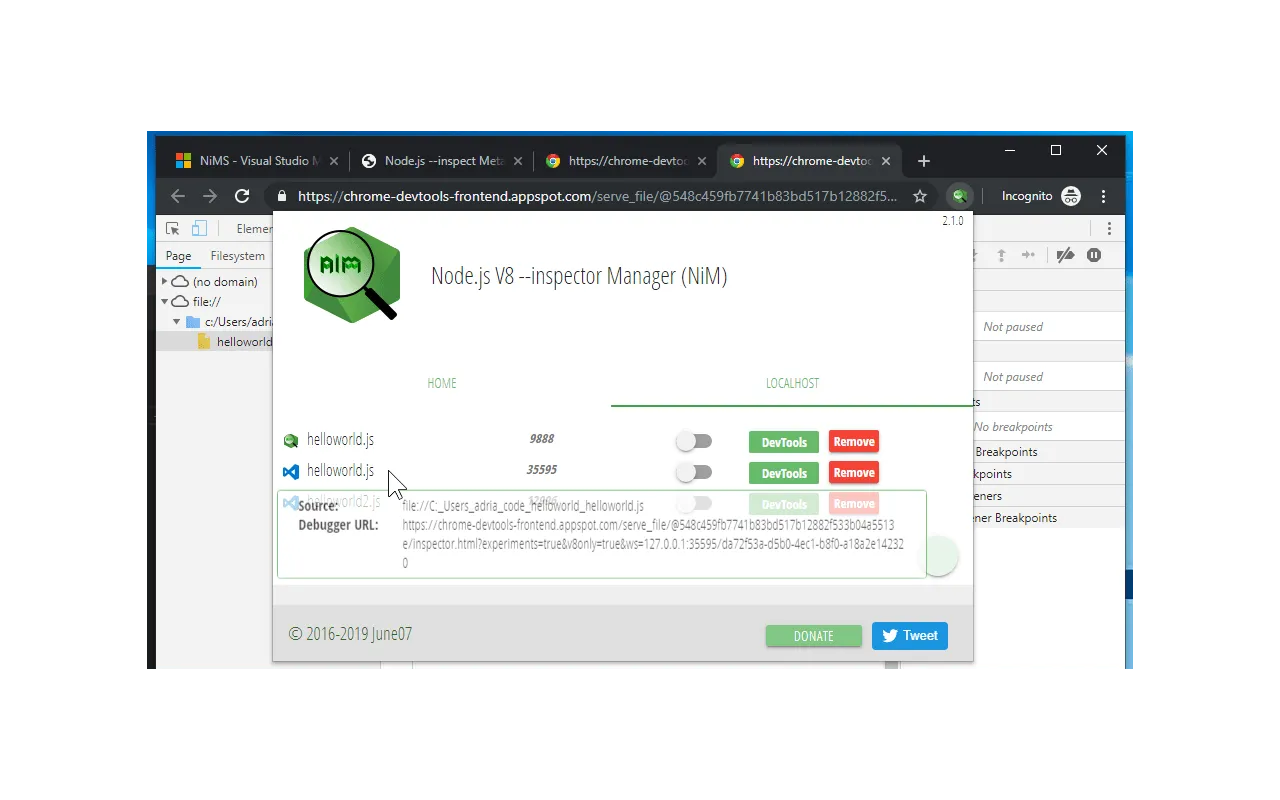
Anyhow, using the NiMS extension gives any third party tools access to node inspect metadata. NiM specifically has the "VSCode Integration" feature built-in such that enabling it will cause NiM to automatically detect debugging sessions that are running under VSCode. The following image shows NiM detecting the child node process helloworld.js that was started in VSCode and who's debugger is running on port 35595:
Further as shown above and in the GIF below, with the NiMS VSCode extension, cross-platform/cross-tool team debugging can be accomplished easily by generating and sharing tunneled debugging sessions with a single click. So while you are debugging in VSCode on Windows for example, you could share the generated link with a friend who's on a Macbook and who's tool of choice is Chrome DevTools, and by pasting that URL in Chrome, instantly be connected to the same debugging session in DevTools. That simply both of you could be stepping thru the code and setting breakpoints together.

2. Custom DevTools
The inevitable fact of life is, every tool when used will eventually break. Chrome and Chromium browsers ship with a specific version of DevTools and that's what you get. It has been the case (as is the case with software, Google not being immune to the aforementioned fact about tools) where bugs in the actual DevTools source code have caused many developers' workflows to break (or more accurately not to break)
- 03/13/2019 - Issue 941608: Can no longer debug NodeJS with Dedicated DevTools for Node
- 06/12/2018 - Issue 851853: breakpoints broken in js_app.html
- 06/11/2018 - Issue 851575: Reactivating a breakpoint reactivates the other deactivated breakpoints
- 05/17/2018 - Issue 844070: Breakpoints stopped working for Dev Tools - Node.js inspection on Windows
- 05/10/2018 - Issue 841697: Node debugger no longer stops on breakpoints
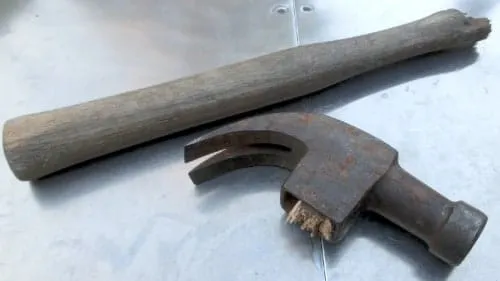
In situations like this what happens? Well pretty much the same thing that happens when you're working on your house and your hammer breaks. You either end up using something else (that you shouldn't) as a hammer, causing yourself even more headache... or you take a trip to your local hardware store and purchase a replacement hammer. Either way it goes, the result is lost time, lost productivity, and a break in your workflow. Wouldn't it have been nice to have a spare on hand. Well essentially that is what the "Custom DevTools" option provides.
In the unfortunate event that whatever version of DevTools Chrome/Chromium happens to be at breaks... NiM lets you use that "spare" DevTools version until the great folks who make up the Chrome DevTools team are able to fix the mainline version.
3. Vendor Agnostic
Apparently StanleyBlack&Decker is the largest global tool maker and owns 14% of the global market share of hand tool sales. There exist many brands under their umbrella, including the obvious Stanley and Black + Decker, as well as DeWALT, Craftsman, MAC TOOLS, and more. And each of the specific brands just listed sell hammers, and more than one. Anti vibrating, ball peen, framing, nail... Any way you look at it, many tooling options exist, be it via the parent company that owns the brand, or the brand itself, or even specifically in the type of tool (in our case a hammer) the brand sells. In that sense, Chromium as a browser engine is no different (the tool). Many flavors of Chromium browsers exist and it's really up to the preference of the user as to which is best suited to the job at hand.
NiM being an extension the the Chromium engine, lends itself to playing nicely with them all, not just Chrome. Further as it's been shown, NiM can interoperate with tools like VSCode. NiM is truly vendor agnostic. I'm not a gun person and I would have loved to stick with the hammer illustration as used above but I must stretch a bit and say that NiM could be likened to this tool:
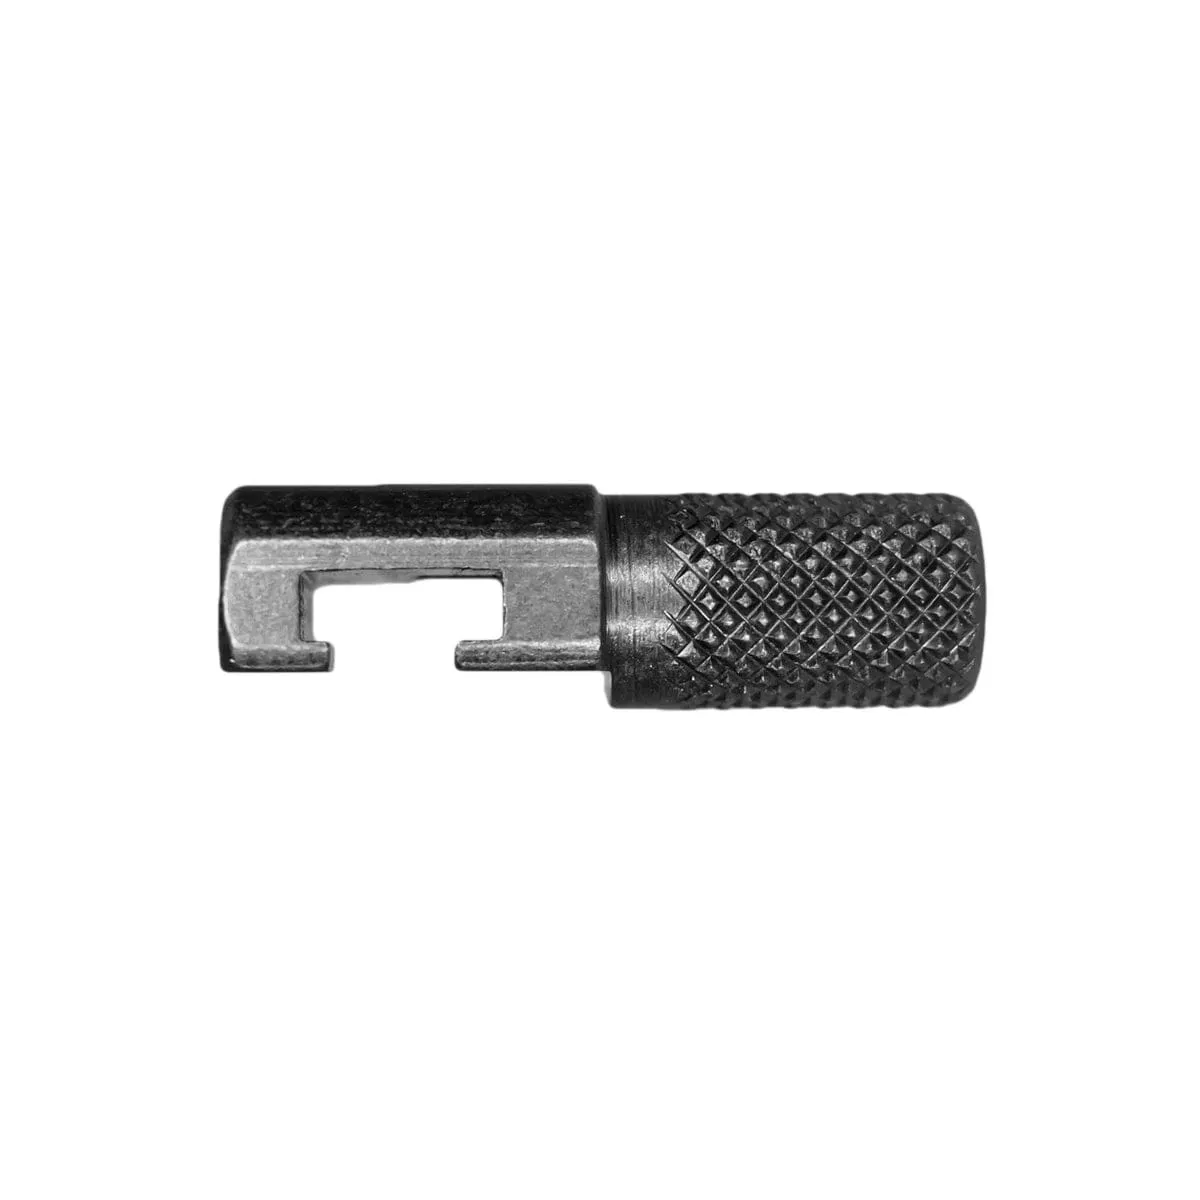
Seems (search "hammer extension" in your favorite search engine) they are rather popular amongst the gun toting members of us! And they seem to be relatively universal in nature or at least usable across a range of products.
Conclusion
Hopefully I've shown how NiM remains a useful tool in debugging Node.js and ultimately can help to improve developer workflows. Certainly it's been shown that parity of features between Chrome DevTools and NiM doesn't exist and in fact that isn't the goal. Along with being vendor agnostic, flexible via the use of custom DevTools, and integrating with other tools such as VSCode, NiM offers much more. The development of NiM will continue with a focus on adding/completing features that are both unique to NiM and that further aid in an improved debugging experience.