Flexibility in Engineering: A Lifesaver for JavaScript Devs & DevTools Users
A DevTools bug in Edge hid breakpoint indicators, disrupting workflows. NiM’s external Chromium debugger at devtools-frontend.june07.com restored functionality, proving the importance of flexible tools and solutions to maintain productivity during browser issues.

Engineering often demands resourcefulness, and few moments highlight this better than encountering a critical browser bug. Currently (since Nov 19, 2024) a DevTools issue in Microsoft Edge is disrupting workflows, leaving engineers searching for solutions. Enter NiM and its hosted DevTools frontend at devtools-frontend.june07.com, which provided a seamless alternative by leveraging Chromium’s debugger, Google's project obviously but the most recent releases built and maintained by NiM's developer.

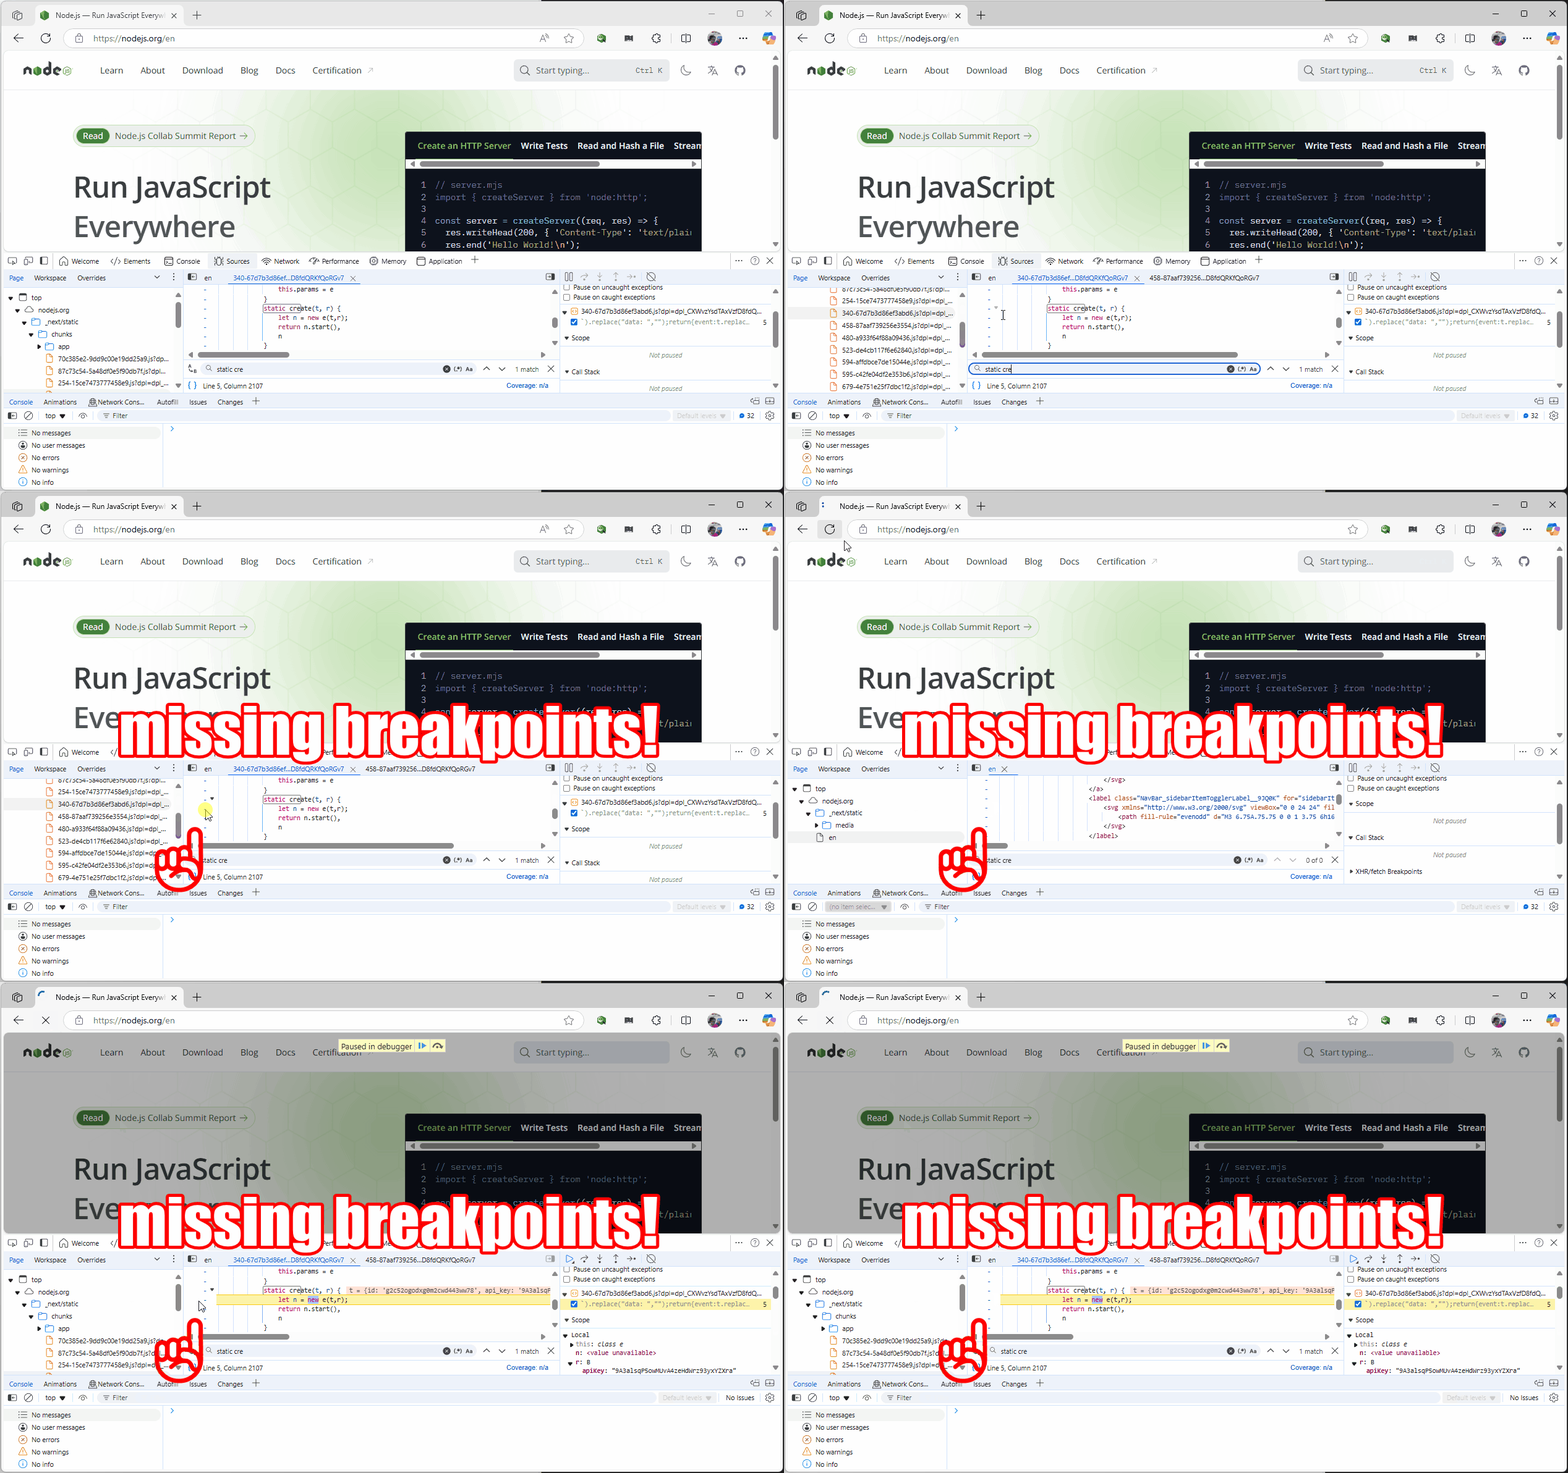
The Problem (Breakpoint MIA)
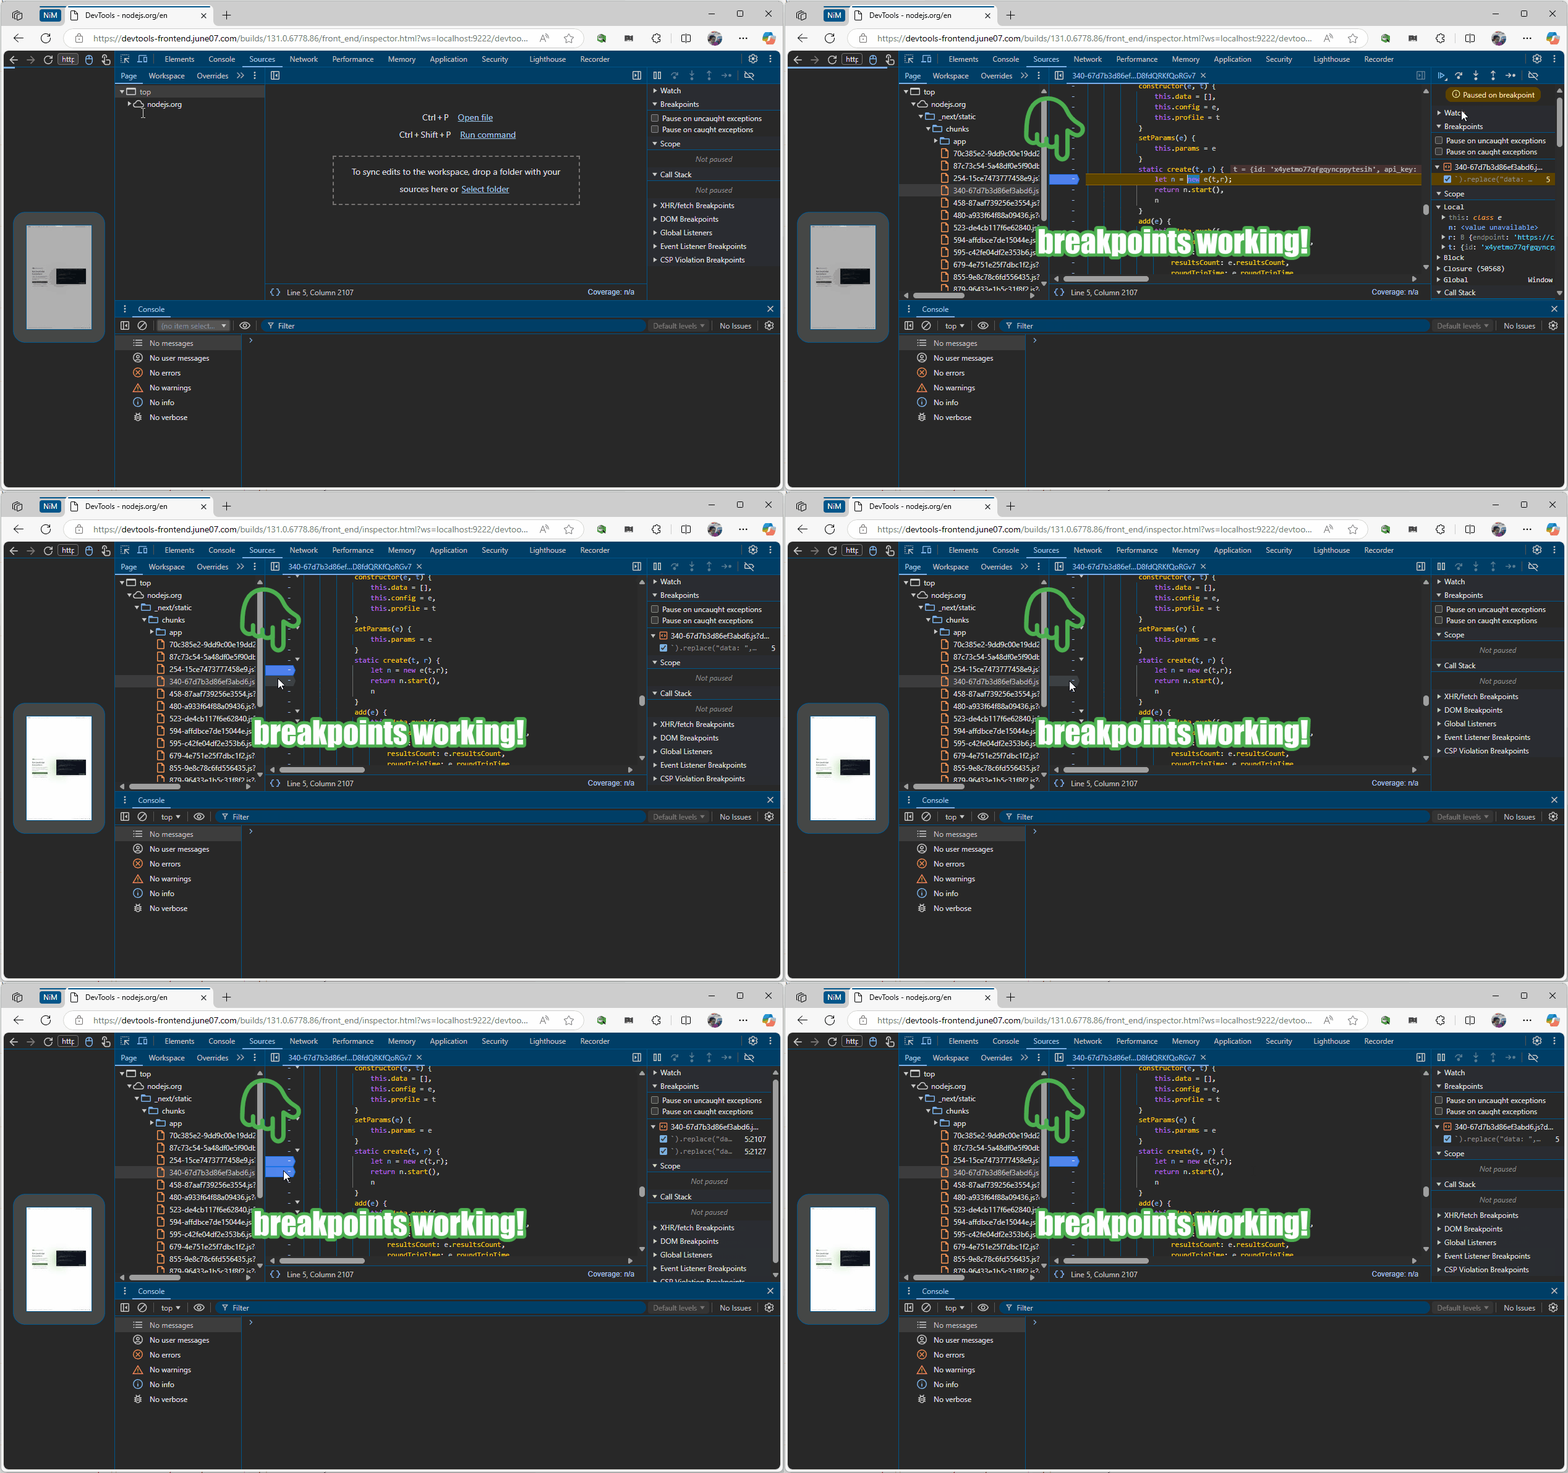
As the gif above shows, the visual indication of breakpoints is missing... so while they technically work in as far as stopping code execution, they are not visible so that doesn't help. In the second gif below however, you can see how breakpoints should be visible (Edge does style its breakpoint a bit differently but you get the point).
The Fix (Breakpoint Found)

Honestly it seems like browser release cycles are so frequent that one easily grows tired of seeing that update your browser icon in the upper right corner... until it doesn't. As this current incident shows, it can often be days/weeks until a fix is released. Needless to say, the show must go on, and development can't simply "wait", as frustrating as it might be to work in a broken state. And certainly, this qualifies as "frustrating" since you can't even tell where the breakpoints visually are but rather defer to guessing. And if there are many breakpoints in close proximity, that only exacerbates the frustration.
As you can see in both cases, Edge is the browser that is being used as a window into the DevTools debugger UI. The difference is in what particular version of DevTools is being used. In the case above that would be https://devtools-frontend.june07.com/builds/131.0.6778.86/front_end/inspector.html?ws=localhost:9222/devtools/page/A0025310FC781BF070FA96480519015B instead of the native browser version which is currently affected by said bug.
An important point of note is that in order to inspect the browser from outside of the browser which is essentially what we're doing in this case by using DevTools not built alongside Chromium (which uses IPC to communicate the devtools protocol between your browser tabs and DevTools), you need to start the browser with these flags:
"C:\Program Files\Google\Chrome\Application\chrome.exe" --remote-debugging-port=9222 --remote-allow-origins=*

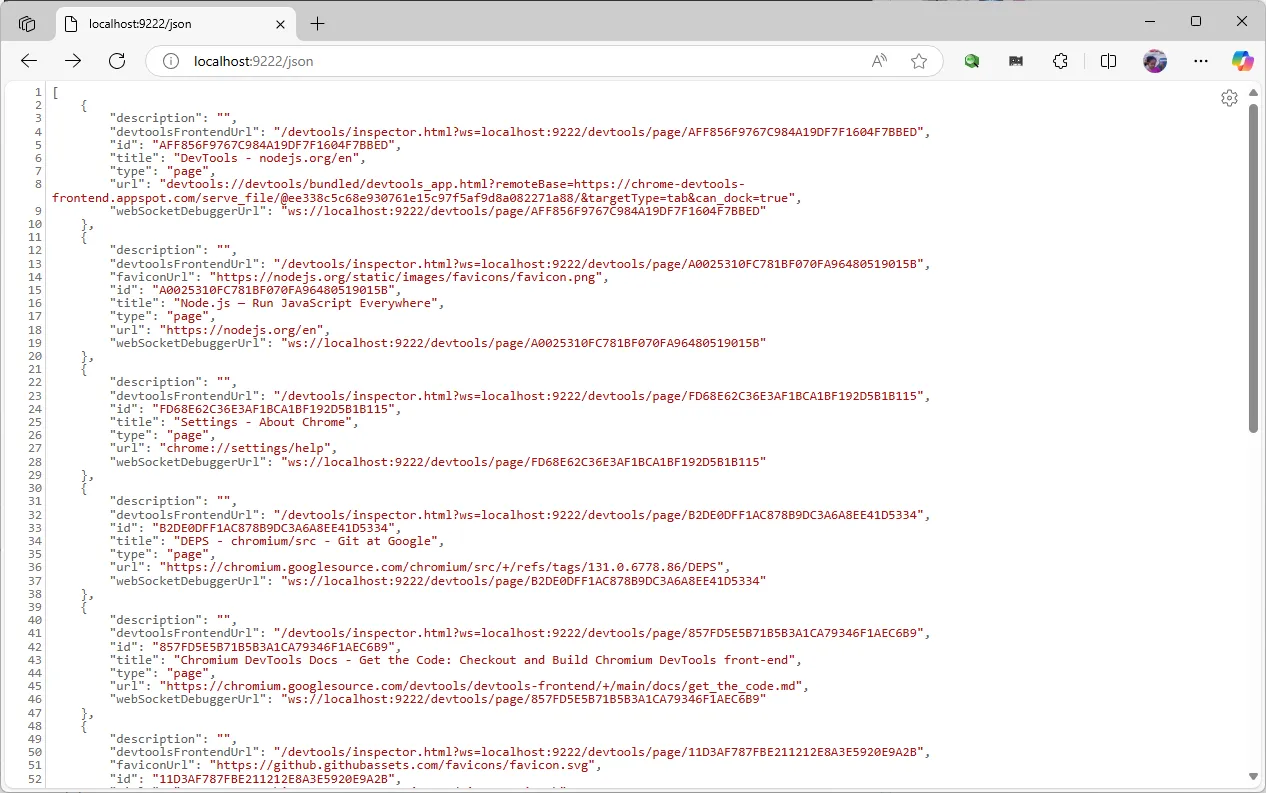
Thanks to this guy for his nice page listing all of command line switches for Chromium! Using said switches, you will have access to the JSON endpoint listing your debug targets which further have the web socket connection info you need for the DevTools frontend to connect.
You might be wondering why I'm using chrome.exe instead of msedge.exe, well that's just because I like separating concerns so to speak. Furthermore, since I'm opening up things a bit by using the additional command line switches, it's safer to separate out purely dev/debugging work from whatever other browsing I might be doing. This example very well could have just used Edge without Chrome at all, because the use of the extra switches only buying us access to the debugger stuff, rather than anything related to DevTools (that is remote... or could be local...) And your next question might be, "Well, then why not just switch to Chrome to debug?!", and yes, that is yet another solution given you're going to use Chrome like I have.

Conclusion
This incident reaffirms the value of flexibility—not just in tooling but in mindset. With NiM and associated tools, engineers turn obstacles into opportunities, adapting quickly and keeping productivity on track. Flexibility isn’t just a principle; it’s a necessity.